Quantifying the value of bounce rate for ecommerce

At a very cursory level, bounce rate is designed to tell you if your content is meeting your audience’s expectations or not. But if there’s one thing I’ve learnt over the years, it’s that this metric should never be taken at face value.
Whilst Google describes it as the percentage of single-page sessions, it is more broadly accepted to be a visit with a single engagement or interaction hit, which may include a pageview, but can also include an e-commerce tracking, event tracking, or a social interaction hit sent to the Google Analytics server.
For the sake of clarity, there’s always Avinash’s more succinct summary: “I came, I puked, and I left”.
Yet the trap that many e-commerce sites fall into is seeing this metric and immediately making assumptions, without fully understanding the context within which it is being calculated, or the numerous external factors that may be influencing it.
To name just a few, bounce rate can be affected by:
- Page type
- Industry
- Seasonality of content
- Site design
- User’s stage in the buying cycle
- Device
- Intent
- Page speed
Faced with such a number of variables, the key to getting meaningful data and insights from bounce rate is ‘relativity’. Considered in isolation, bounce rate is all but meaningless. But considered relative to the likes of page speed, device or channel, this metric can offer rich, quantifiable insights into your content performance. So how exactly do you do that?
Experiment With Custom Reports
Example: Page speed vs. bounce rate
Page speed and bounce rate go hand in hand. The two are so closely interlinked that to consider one without the other would be futile. As page speed varies by device, so too does bounce rate. As such, bounce rate should form a key metric underpinning any mobile optimisation strategy, not least because it acts as a strong qualifier for optimisation in the first place – just in case you needed any further convincing.
To analyse the correlation between the two in more detail, I commonly use a great custom report recommended by Avinash Kaushik. It’s quick and easy to set up, as follows:
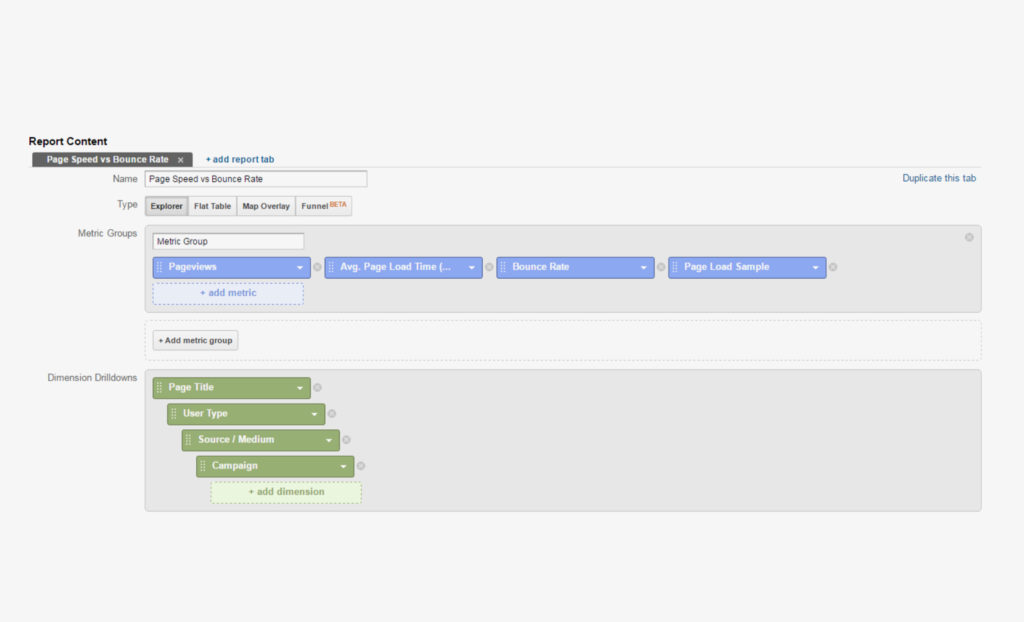
And offers a page-level overview of these two correlative metrics, side-by-side:
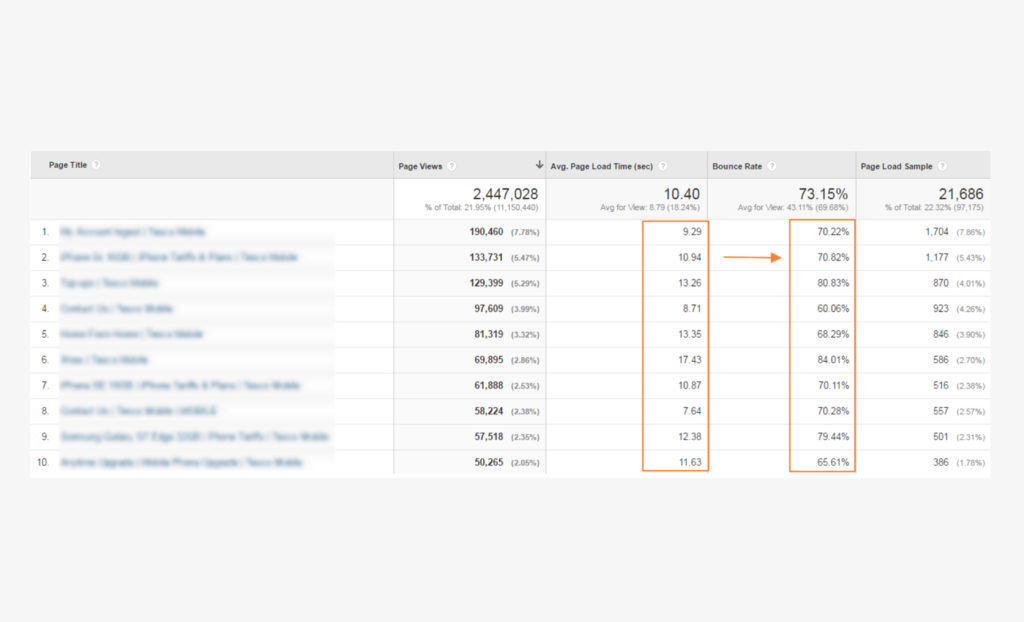
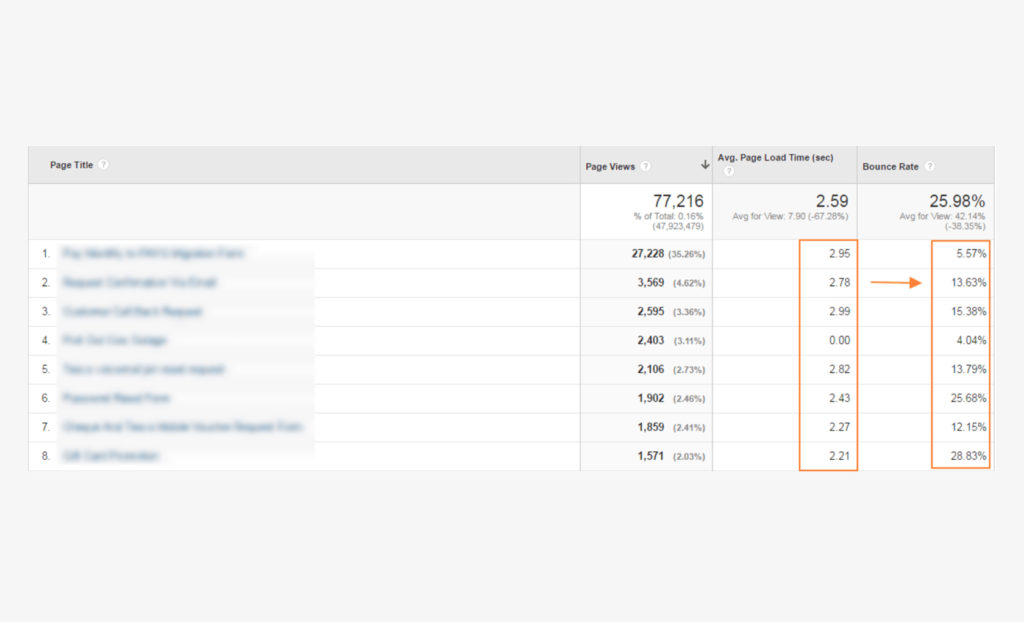
As can be seen above, we now have quantifiable data showing us that bounce rate is directly linked to the average load time of the page, therefore acting as a significant barrier to user engagement with our content. If we pour time and effort into improving page speed as a priority, we are very likely to see improved bounce rates across mobile, desktop and tablet, and a much better all-round user experience, as shown below for pages with a sub-3 second load time:
This is just one of many custom reports that can be set up to analyse content performance in more detail, and offer fresh insights into such a misunderstood metric as bounce rate. If you are a content strategist and don’t currently spend a good portion of your time experimenting with custom reports, I would strongly encourage you to do so.
Segment Your Data
Another great way to understand bounce rate in context is to segment it within Google Analytics. The four best metrics that I commonly use to contextualise bounce rate are the following:
New vs. returning
A measure of success for content sites is not necessarily if the reader bounces or not, but whether or not they come back again. As such, segmenting visitors by new versus returning within the Landing Pages report is particularly useful for examining bounce rate behaviour between the two, especially for blog content. Blogs are renowned for having above-average bounce rates. Whilst it’s common for new visitors to bounce at a higher rate than returning visitors, looking at specific sub-sections of pages (ideally using the Content Groupings filter, if in place) will allow you to see if certain types of content are bouncing at a higher rate than others, and you can then look more closely at ways to encourage new visitors to stay on the site a bit longer.
Device
As the intent with different devices varies widely, so too do the bounce rates. Mobile and tablet users tend to bounce at a much higher rate than desktop, since they are more likely to be browsing for information than making a purchase. However, by drilling down to page level in the Landing Pages report and segmenting users by device, you can start to see where the biggest discrepancies in bounce rate lie between the three, and where mobile content may be failing your users.
Channel
Whether it’s organic, paid, social, direct or email, users arriving to your site will have varying expectations depending on the path they’ve taken to get there and what stage of the buying cycle they are at. Once again, if your bounce rate is much higher for one channel than it is for another, it’s likely that your content is not living up to those expectations, so think about how you can better improve the user experience through that channel.
Location
Segmenting by location can be crucial to better understanding both your audience, and your bounce rate. If you are a local business and have an unusually high bounce rate, consider segmenting to the city in which you are operating; it is likely that bounce rate is being heavily skewed by irrelevant visitors to the site, and actually your content is performing much better than you think.
Quantify the Data, Qualify the Decision
As we have seen, there are many different factors that play a contributing role in bounce rate. As such, it is very difficult to make an assessment as to whether your bounce rate is good or bad without first understanding the metric in context. By segmenting the data, you are able to quantify what you are trying to prove, and in turn, qualify decisions that you make about your content to ensure that these are smart, data-led decisions.
Three ways to get the best possible insights from bounce rate
- Always segment your data before analysing for insights;
- Always use custom reports to monitor bounce rate in context;
- Always set your own thresholds of what a good bounce rate should be for your site.
Own your marketing data & simplify your tech stack.
Have you read?
Chrome’s announcement on dropping cookie opt-in last month closed the door on a 5 year saga for marketers. But what is the landscape like in 2025 for cookie-based measurement?

Generative AI is transforming the way that marketers plan and assemble content for their Paid Ads. As big platforms like Google, Meta and TikTok increasingly build the tools needed to...

In a surprising move that has sparked heated debate, Mark Zuckerberg announced on his Instagram that Meta will be reducing its levels of censorship and in particular fact-checking on its...