An ‘N-Gram analysis’ tool in R

Recently, I wrote a post on WebAnalyticsWorld talking about using ngrams to help analyse keyword performance.
To quickly summarise that post:
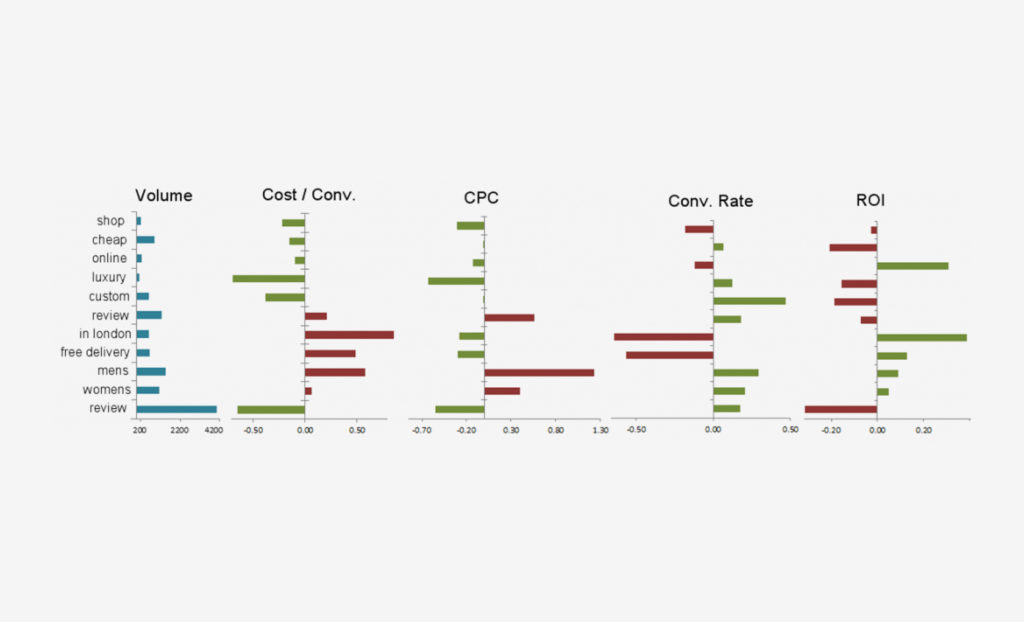
- An ‘n-gram’ is “a continuous sequence of n items from a given sequence of text or speech”, or a string of words of specified length
- Splitting keywords into n-grams and aggregating data lets you dig for performance traits (positive or negative) and try to understand the effect on performance of certain phrases
- The article then runs through a quick and easy process to perform an n-gram analysis in Excel
As this is quite a useful activity, I wanted to make the process a little bit easier, so decided to build a tool using R, and in particular the incredibly useful package Shiny which allows simple deployment of R scripts as web apps. If you haven’t heard of R, see [here](https://en.wikipedia.org/wiki/R(programminglanguage) for a quick intro.
A Simple Application, Created Simply
This tool is deployed via shinyapps.io – a convenient way to host R apps without having to worry about server configuration, etc. If you just wish to use it, no need to read on, just visit the site:
N-Gram Analysis Tool on shiny.io
The process
I find that one of the most appealing features of R is the ability to perform seemingly complex tasks without having to write too much code. This is further enhanced by the depth of packages available which provide custom functions for specific purposes.
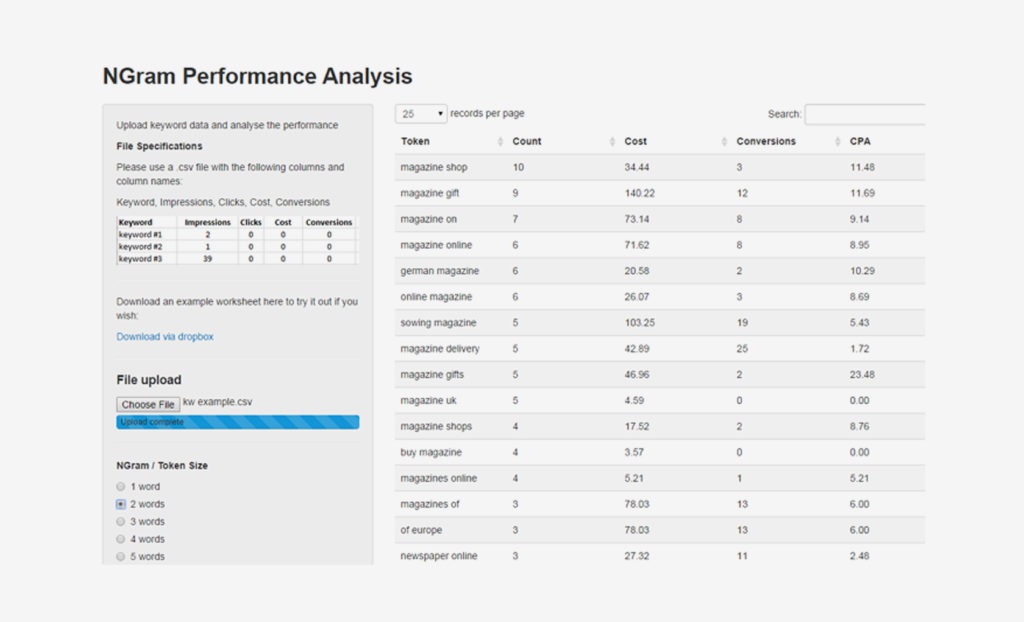
The essence of this app is an R script which uses the Natural Language package ‘RWeka’ to split keywords into ‘tokens’ of specific length.
Following this creation of tokens, all the data is aggregated into a summary data frame using ‘dplyr’.
Finally, a simple application I’ve created using the ‘Shiny’package/framework wraps up the above functions into a user interface. This allows the uploading of a csv file to generate a table of n-gram information.
Appendix for R Users: The Code
#/ read in data /#

ngraming <- function(data, ngram_size){

attach(data)

#/ tokenize keywords/#
#tokens <- MC_tokenizer(data$keyword)
tokens <- NGramTokenizer(data$Keyword, Weka_control(min = ngram_size, max=ngram_size))

#/ Remove duplicates /#
tokens <- unique(tokens)


#/summarize if includes token #/
dummy <- data.frame(Token=character(),
                    Count=numeric(),
                    Cost=numeric(),
                    Conversions=numeric(),
                    CPA=numeric(),
                    stringsAsFactors=FALSE)


tokenData <- lapply(1:length(head(tokens, n=500)),function(i) {

   test <- subset(data, grepl(tokens[i], data$Keyword))

   if (sum(test$Conversions) == 0) {
     cpaCalc <- 0
   }
   else {
     cpaCalc <- sum(test$Cost)/sum(test$Conversions)
    }

   tempDF <- data.frame(Token=tokens[i],
                       Count=length(test$Cost),
                       Cost=sum(test$Cost),
                       Conversions=sum(test$Conversions),
                       CPA=format(round(cpaCalc,2),nsmall=2),
                       stringsAsFactors=FALSE)
    rbind(dummy,tempDF)
  })

detach(data)

tokenDF <- do.call(rbind.data.frame, tokenData)

tokenDF <- tokenDF[with(tokenDF, order(-Count)),]
Own your marketing data & simplify your tech stack.
Have you read?
Chrome’s announcement on dropping cookie opt-in last month closed the door on a 5 year saga for marketers. But what is the landscape like in 2025 for cookie-based measurement?

Generative AI is transforming the way that marketers plan and assemble content for their Paid Ads. As big platforms like Google, Meta and TikTok increasingly build the tools needed to...

In a surprising move that has sparked heated debate, Mark Zuckerberg announced on his Instagram that Meta will be reducing its levels of censorship and in particular fact-checking on its...